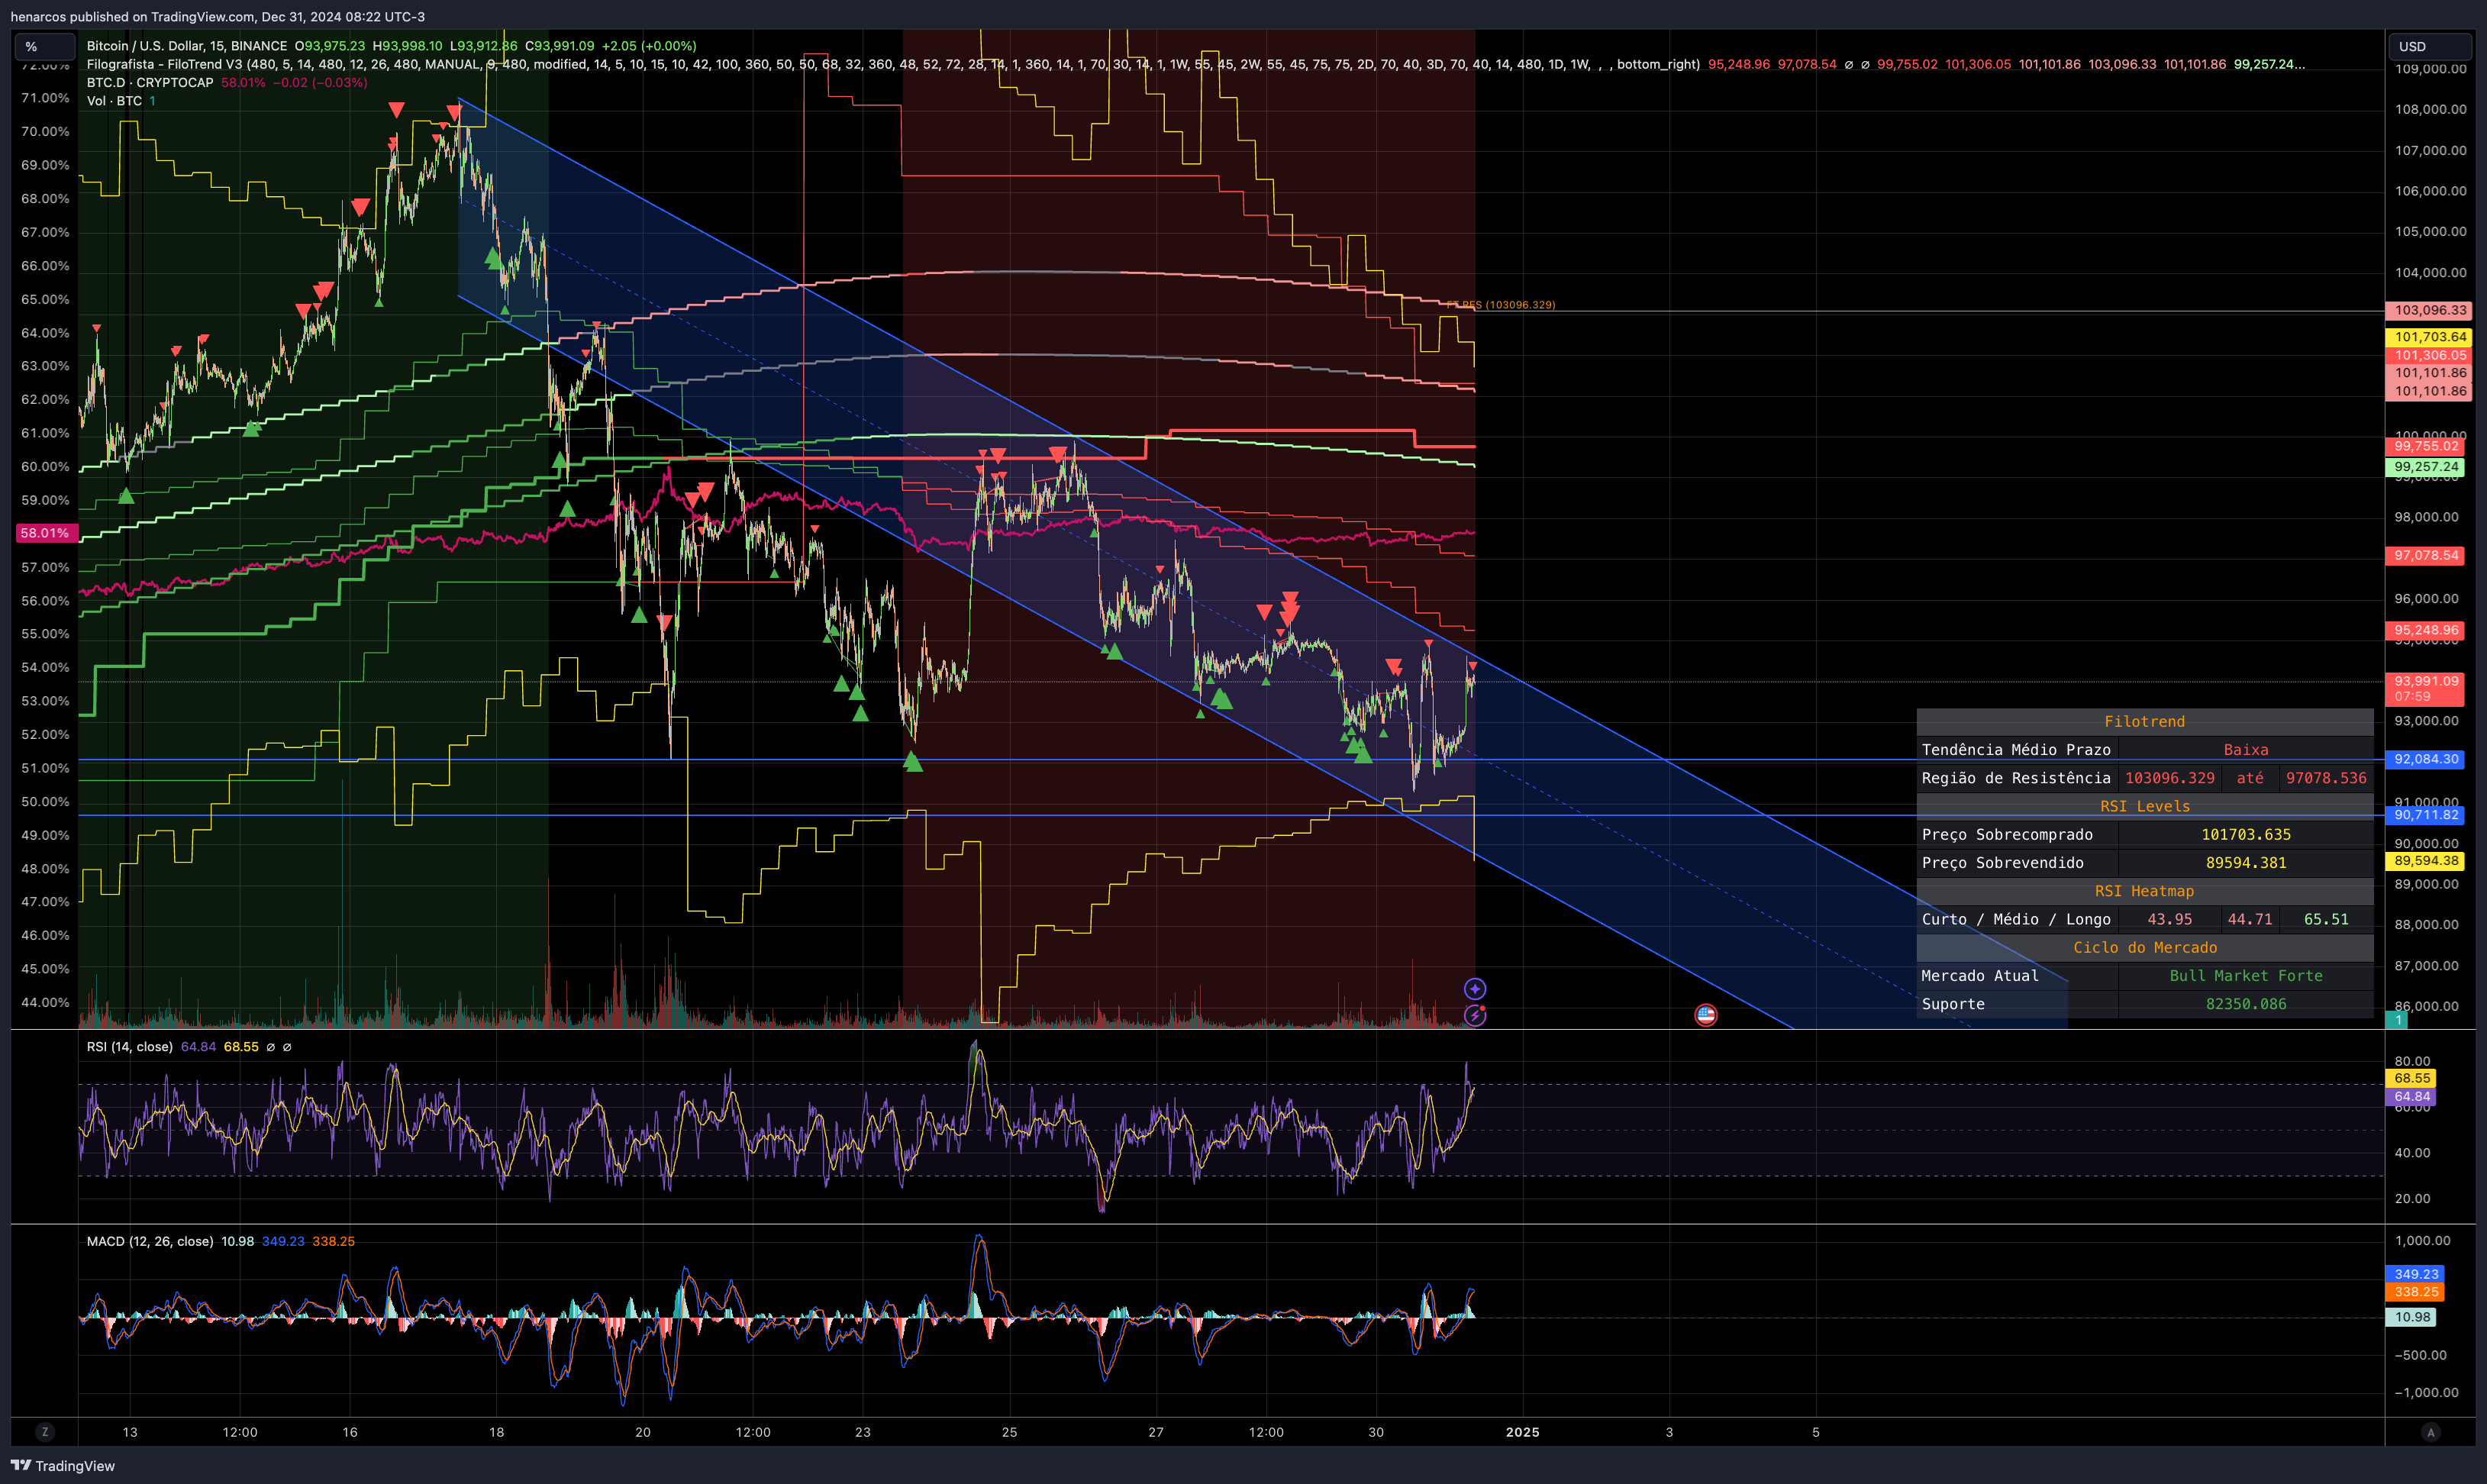
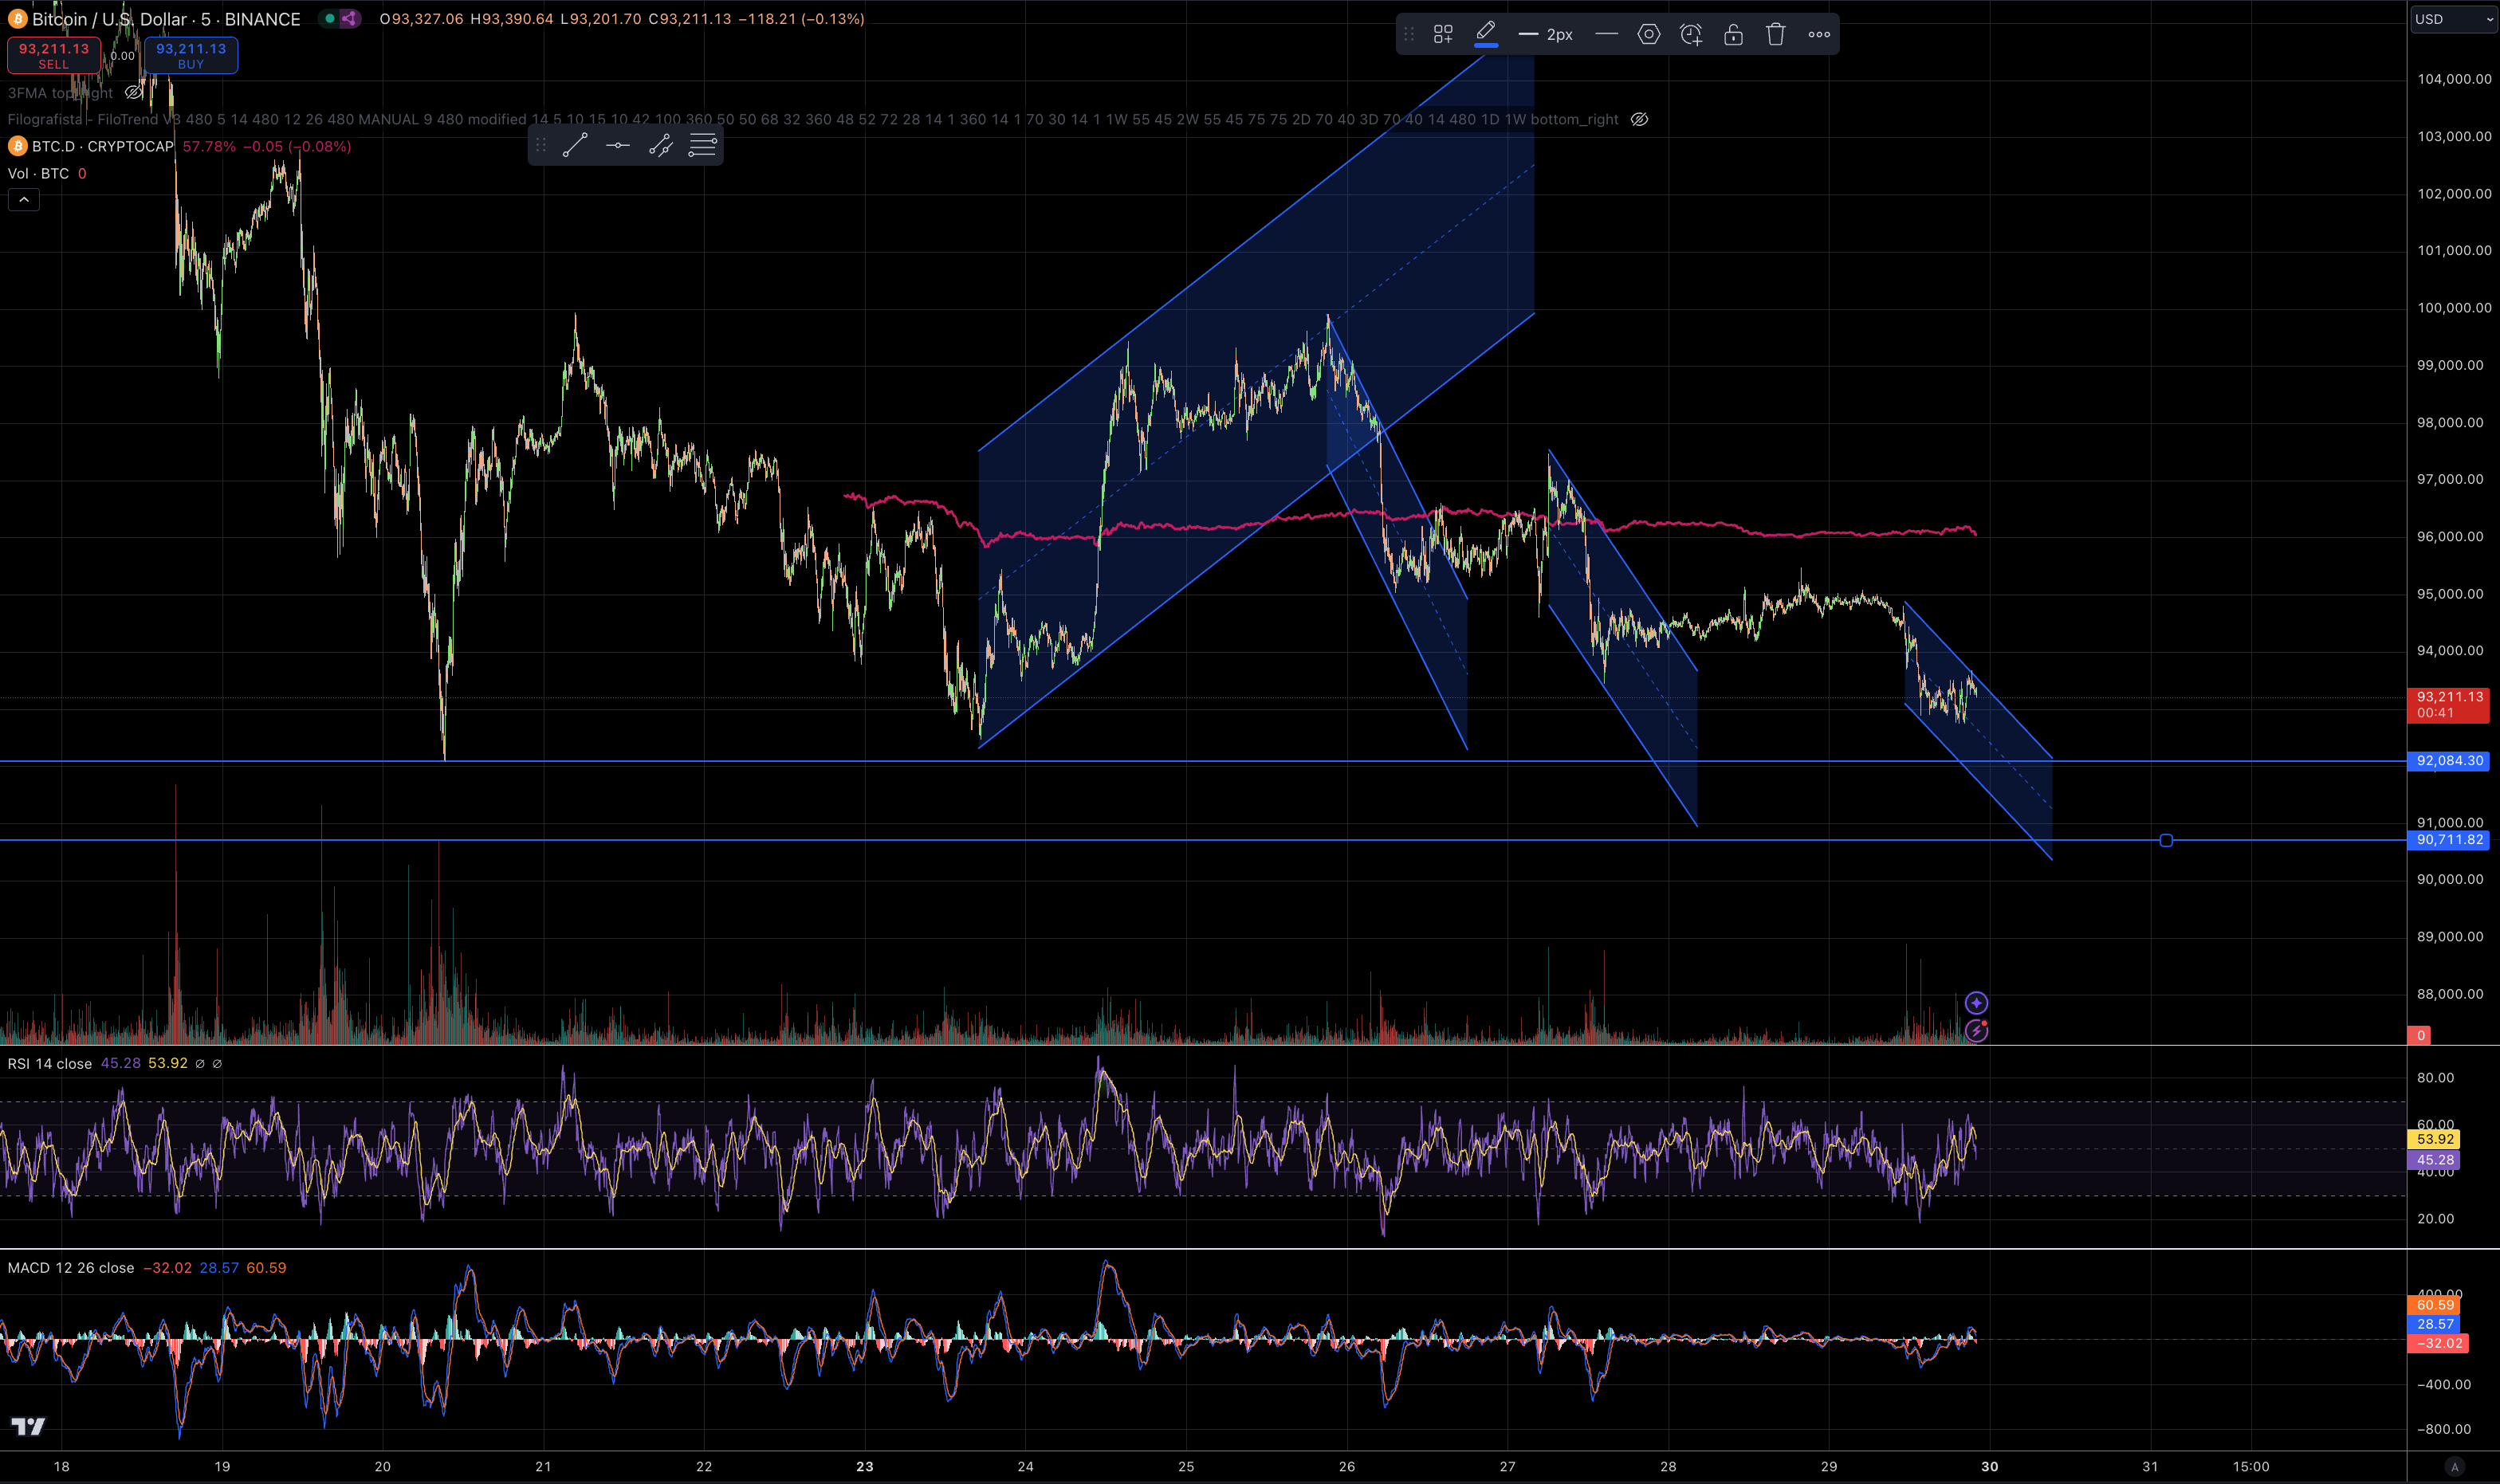
In addition to the ATH, what we are seeing is a drop that forms a descending triangle, as it has been respecting the bottoms around 92k. The challenge of piercing this bottom continues, which would lead to the 90k range. This reminds you of the need to check the charts that cover weeks, even if your goal is the short term.
If you intend to protect yourself a short stop, it means that your target should also be short. It is an illusion to think that there can be a disparity between target and stop, so that your business always looks like a good risk/return.
The fact is that the market will someday fluctuate until it reaches its stop and target. If your stop is proportionally short in relation to your target, statistically you will have many stops reached without having targets reached.
The alternative to this would be to follow closely and set a reasonable stop gain, which is still the setting of a target. Don't be fooled by a good risk/return that will only generate stop losses.
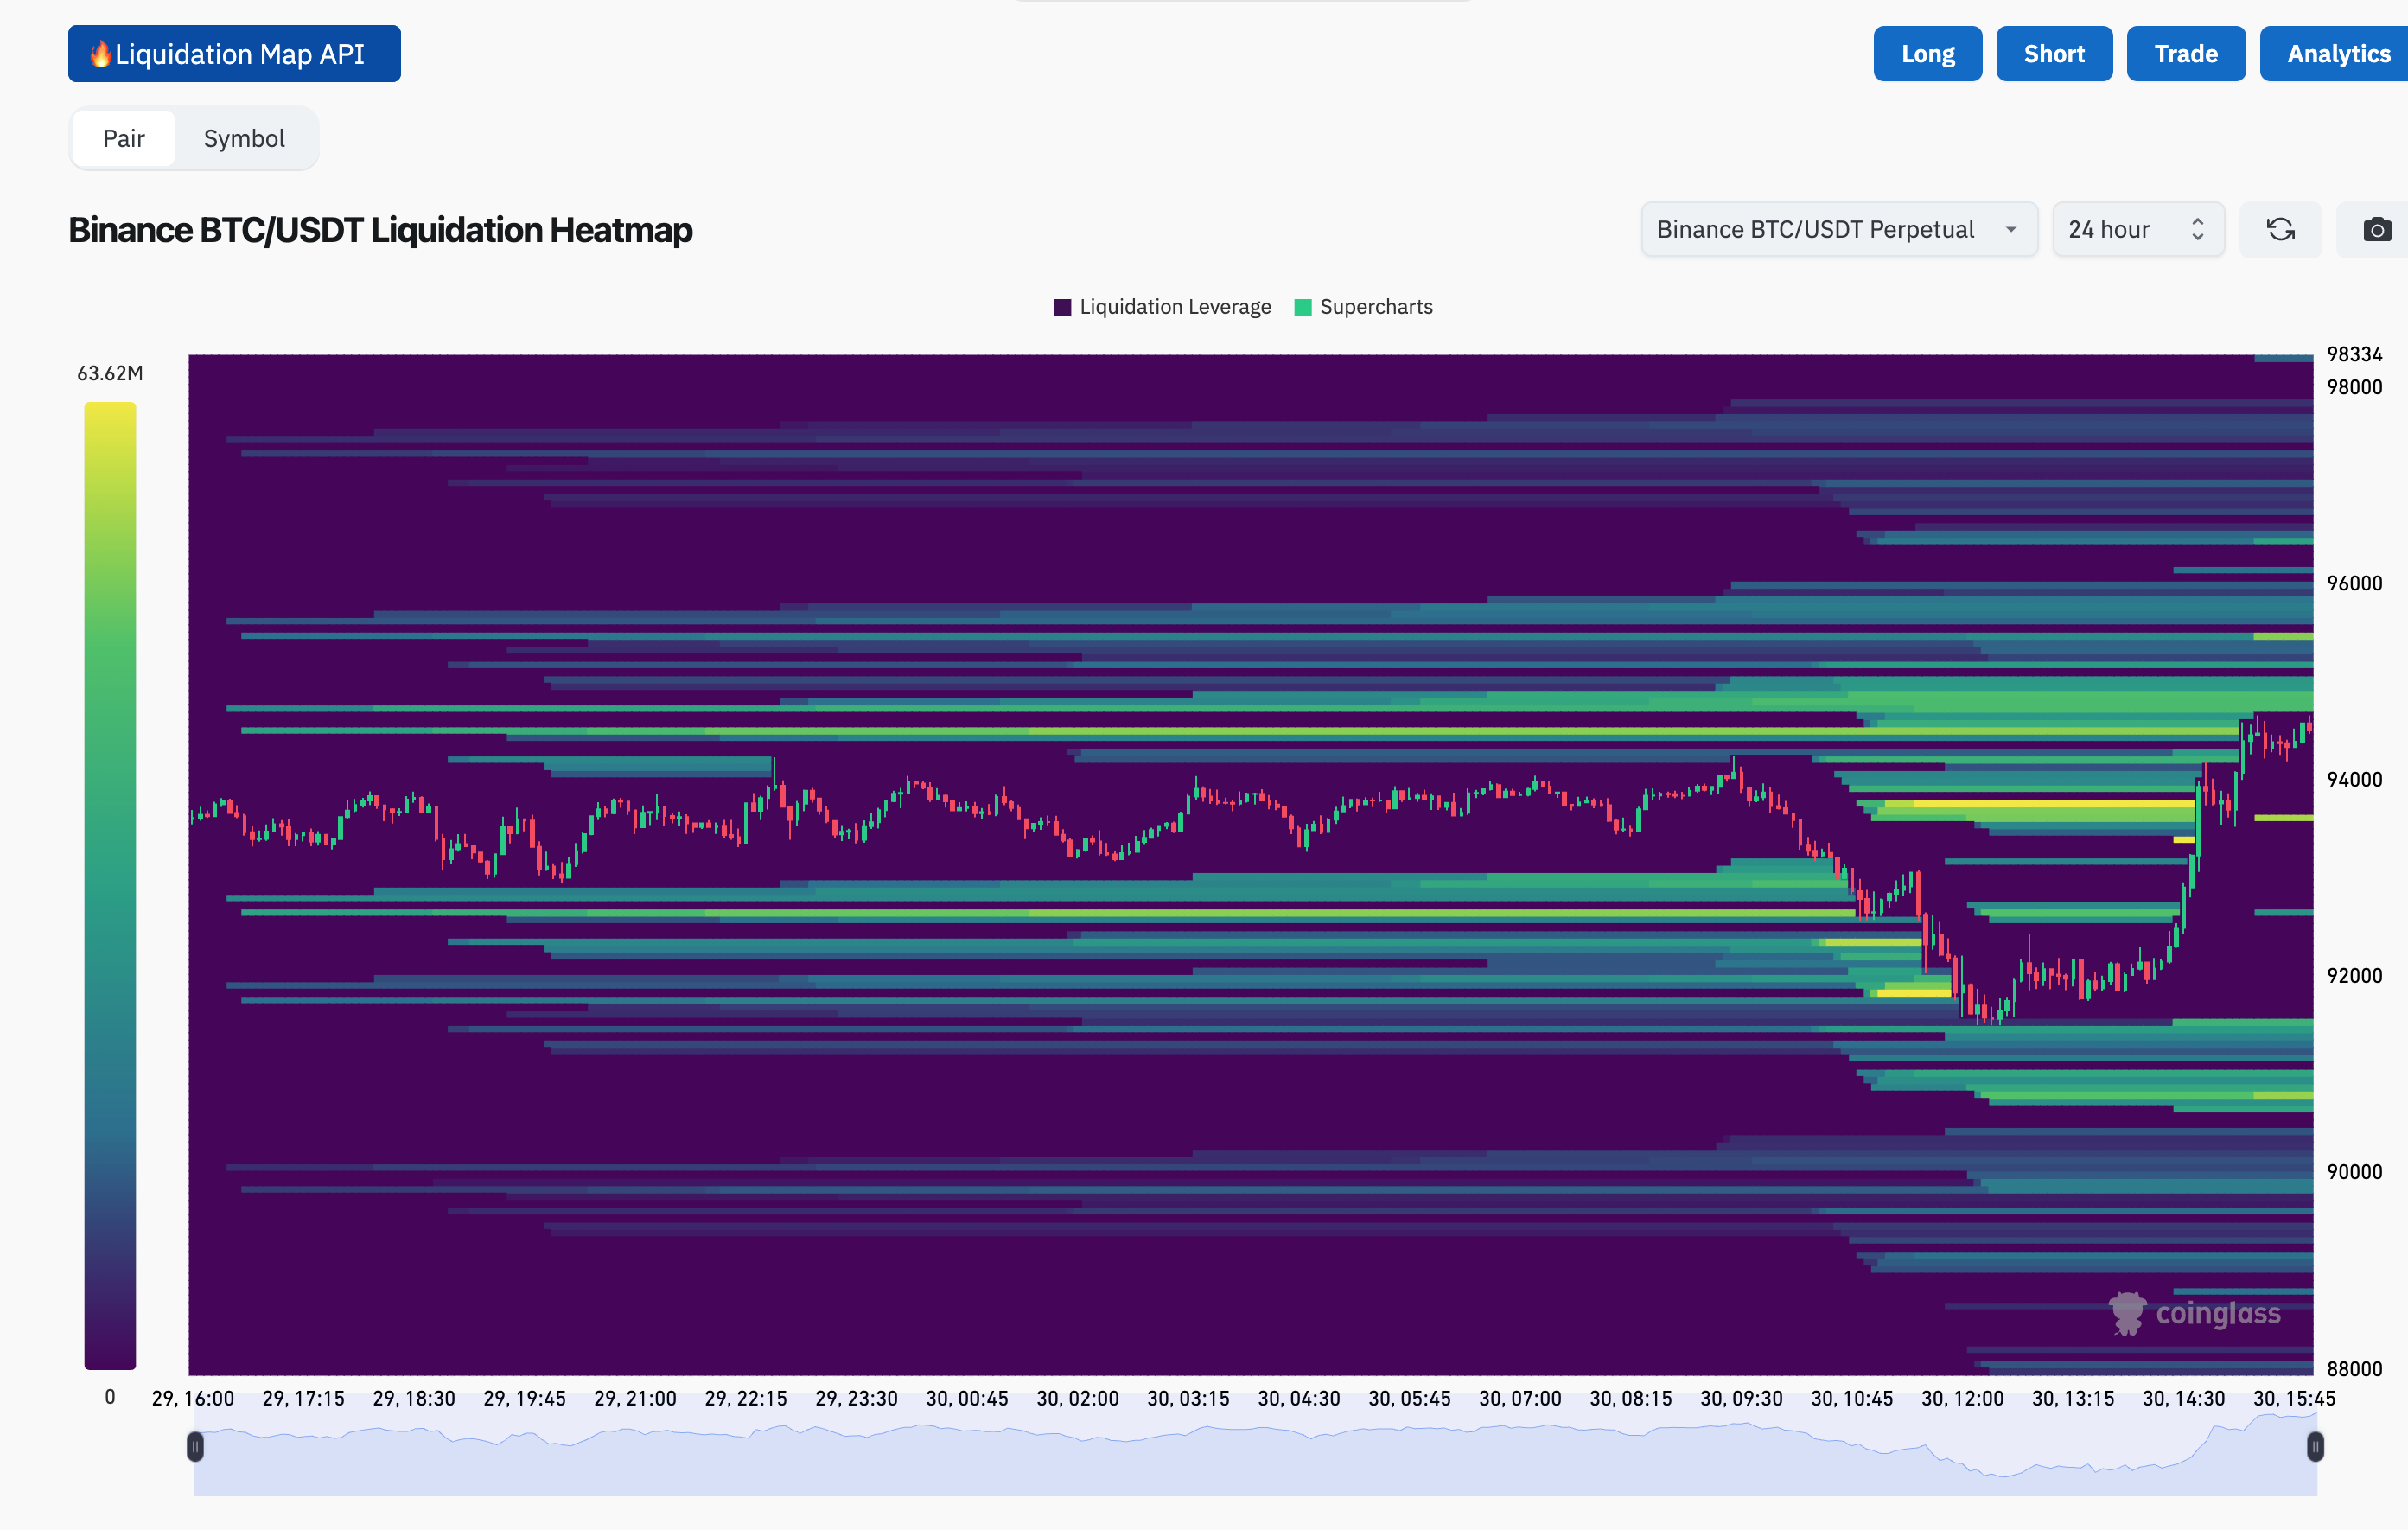
I've always found Coinglass's liquidation chart to be very beautiful, but it doesn't guide your next steps. It shows the volume of liquidations that have taken place, but this does not represent real resistance to the rise/fall of the asset. Sometimes I stop to look, but I don't stop for it, even though it's beautiful.
Today I was on the street and made a purchase on my cell phone at Coinbase. I already knew it was something expensive (1% fee!), but I saw an opportunity while I was at the restaurant.
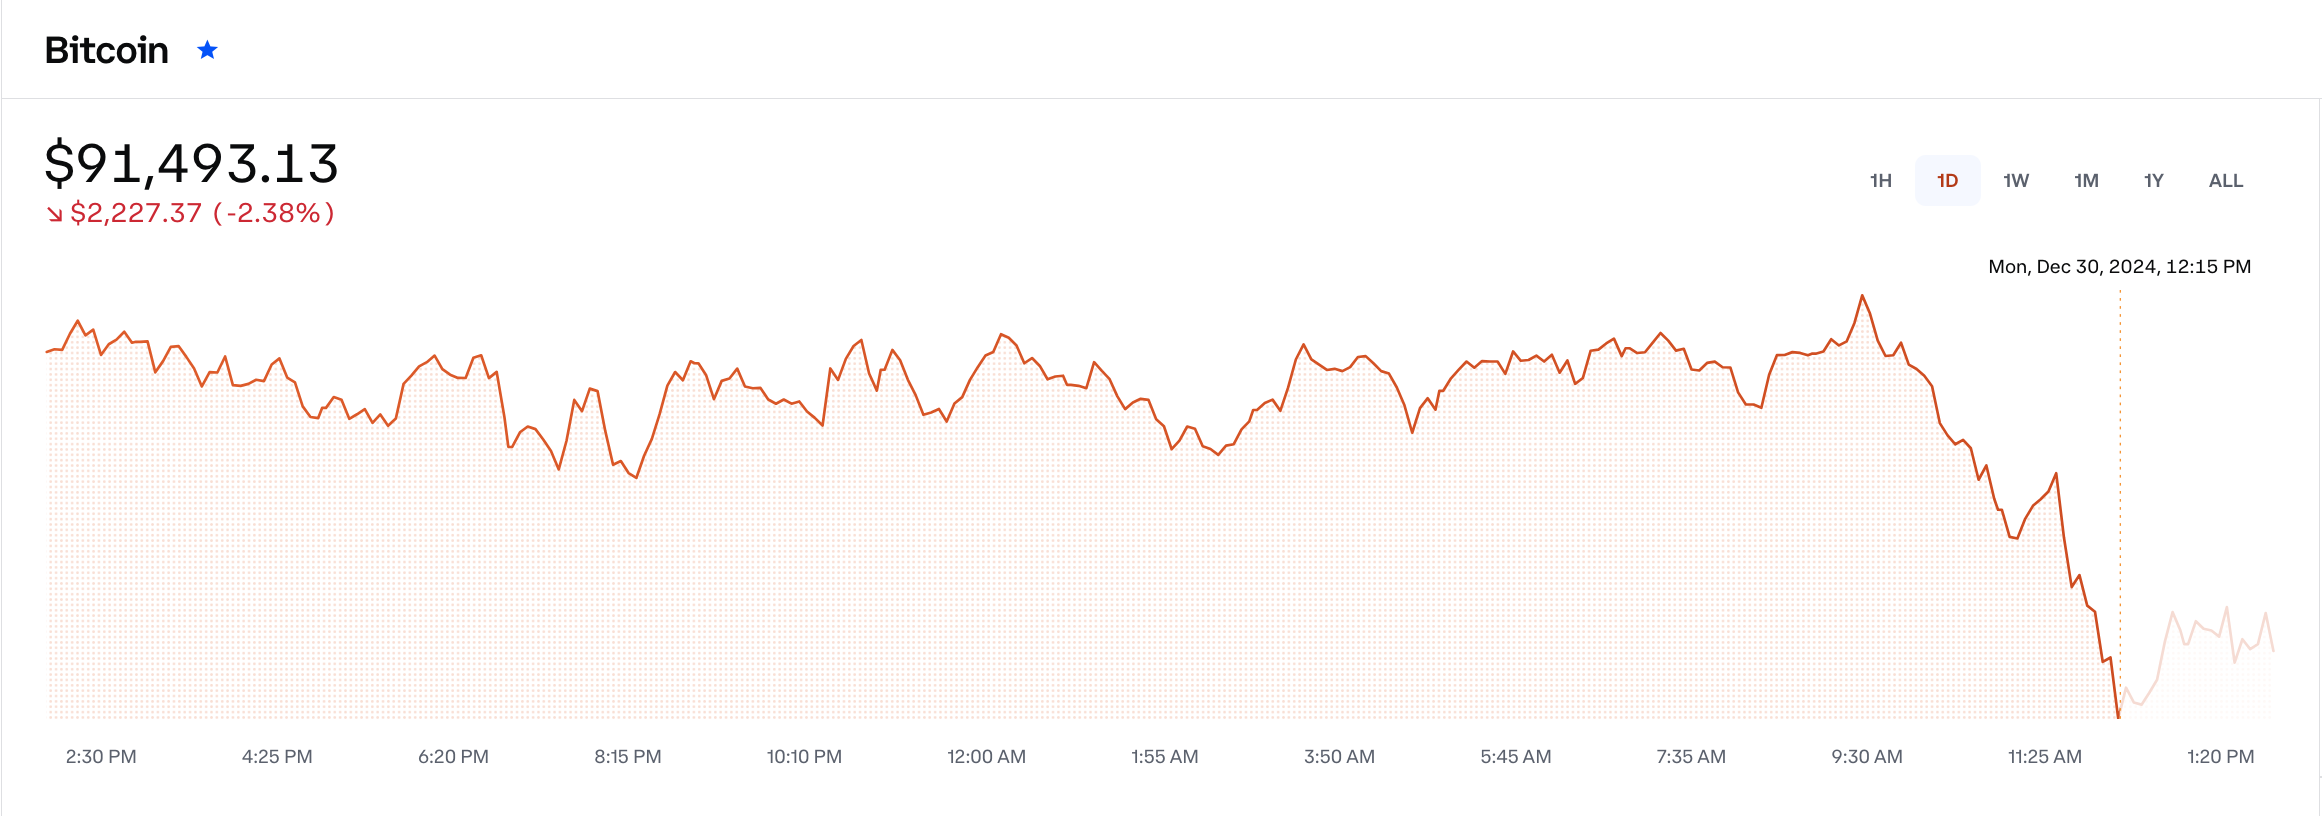
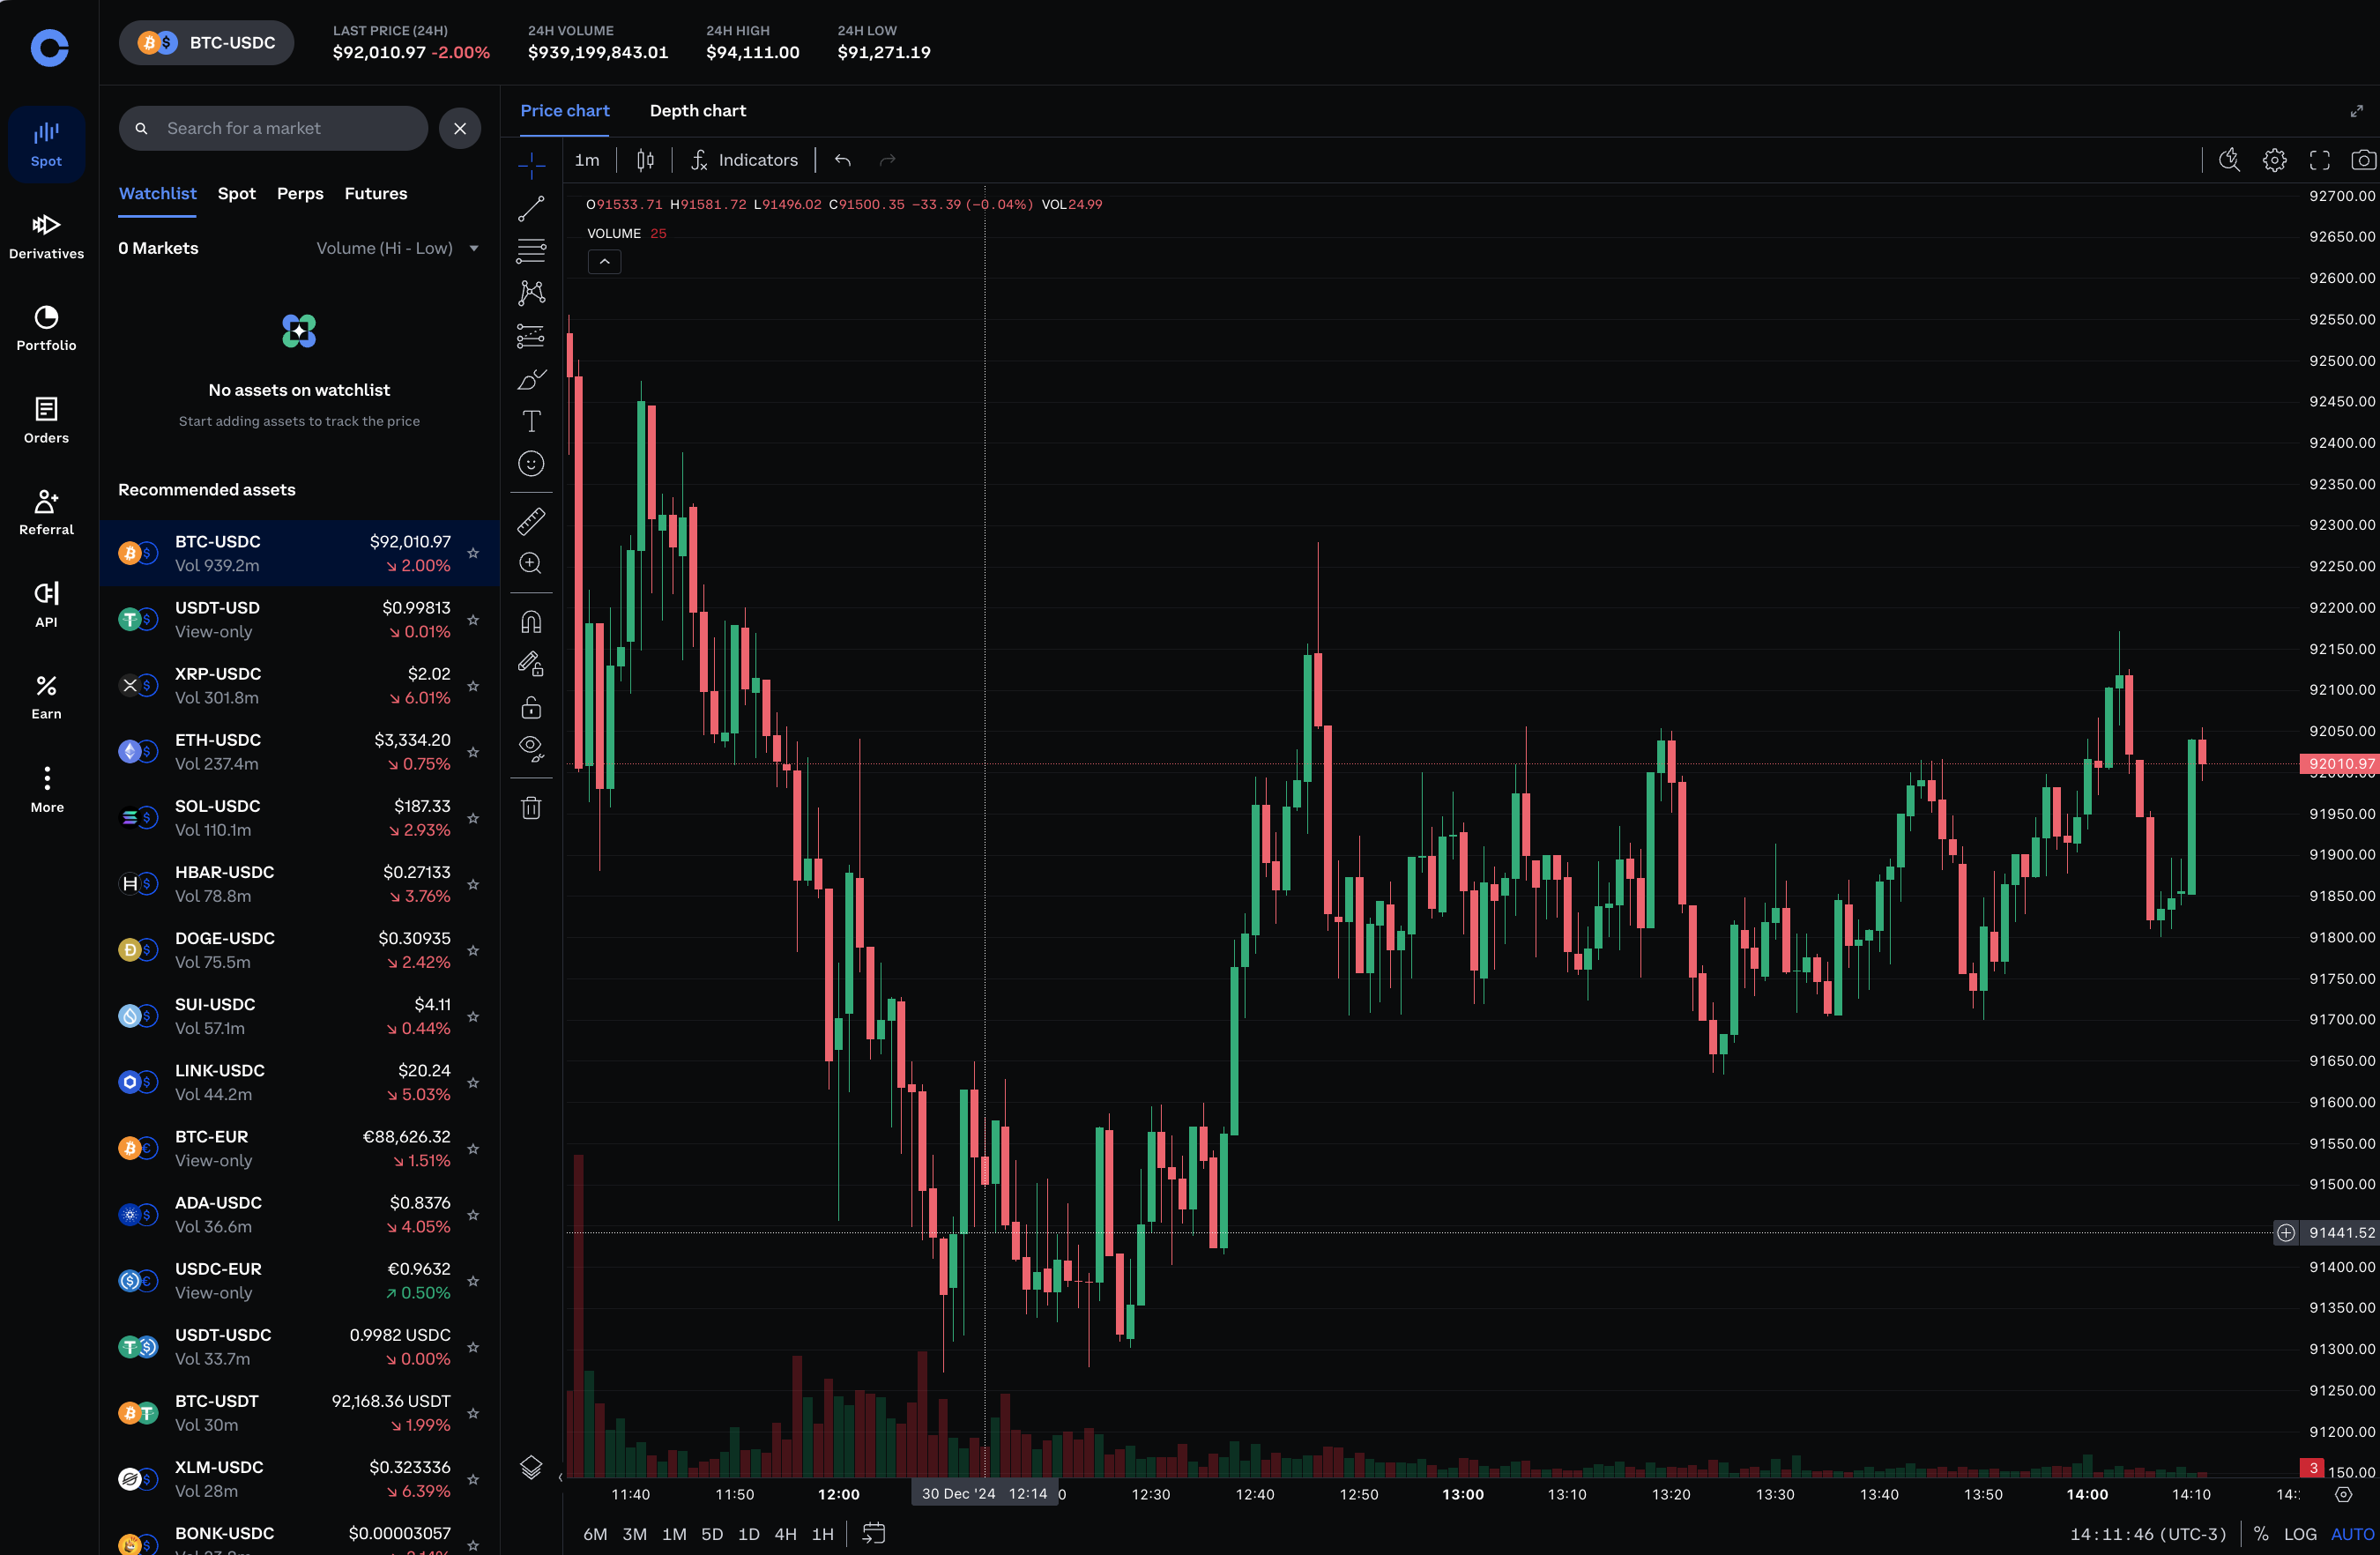
The problem is that, while the receipt informs the quotation of 93k, the ticker shows 91k.
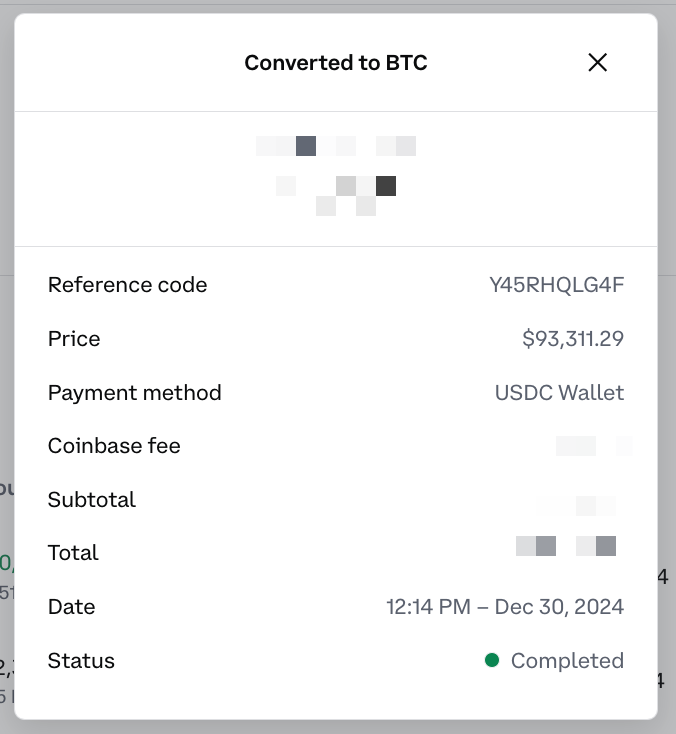
That is, it is only possible to earn money on Coinbase Advanced, an environment in which the fee is reasonable. But with this type of theft, things get complicated.
Contrary to what one might imagine, the trader waits more than buys or sells. If your drawing is correct, it is very possible that the signal will pass exactly along the planned lines. So the good trader, first of all, waits.
After a bottom confirmed on 12/20 and 12/23 (92k), tops came creating resistance (<100k). Then, two drops of more than 4%. If the third drop is the same size, we will be challenging the support that has been coming since 11/26 (90k). Now it's time to follow the channel and see the 92k and 90k tests. That is, if it does not go sideways for another two or three days, which is what happened in the last small drops, a period in which the price recovered half of the previous drop.
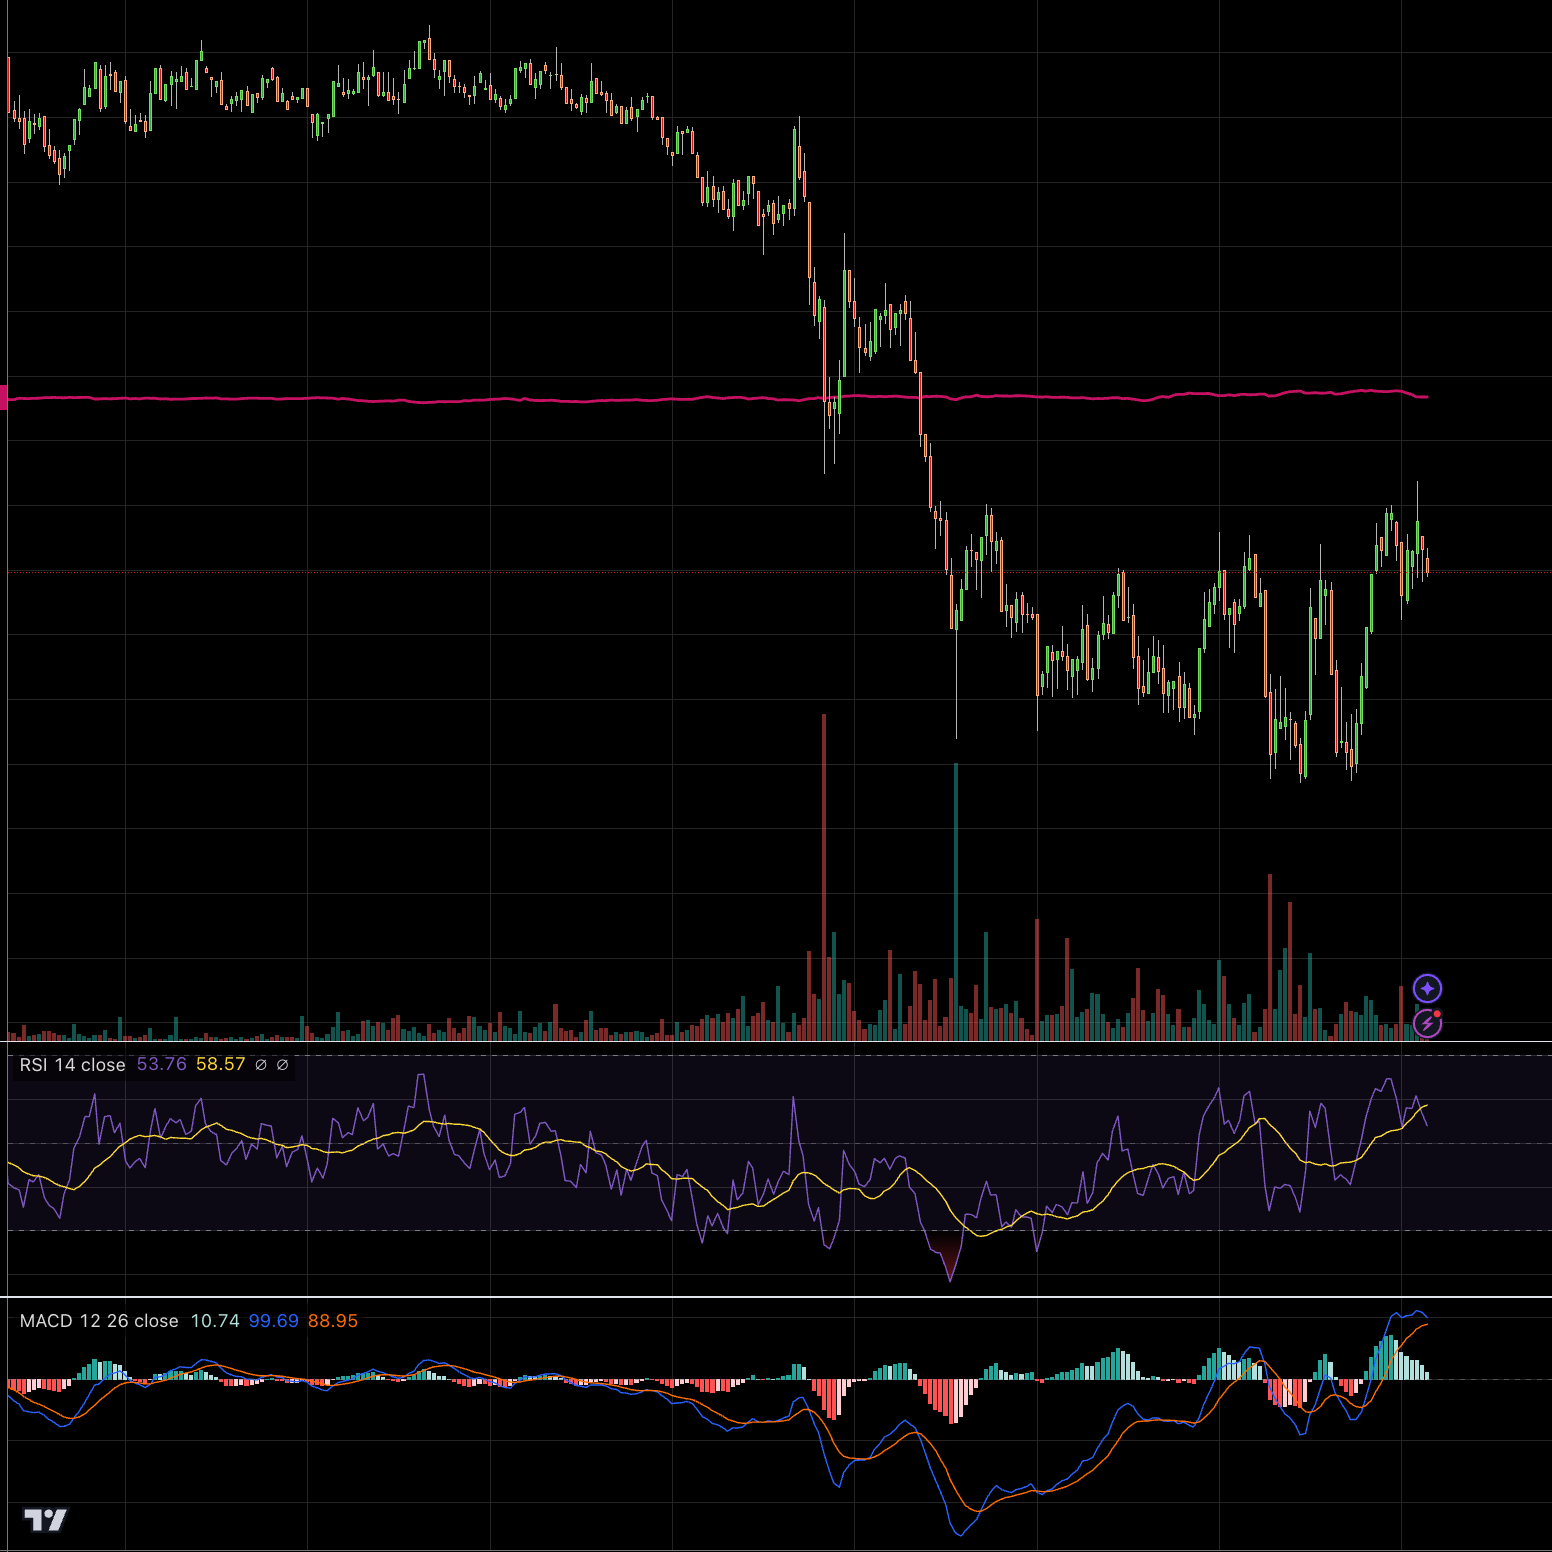
Today I followed a sideways market with increasing volatility throughout the day. It was clear that it was a falling market on several levels, but the problem was volatility.
A descending triangle has not exactly formed, but it is clear that there is resistance accompanied by successive bottoms, which in theory confirms the fall.
Either way, if you look for a short stop in a volatile market, it doesn't work anymore. If you couple these entries with a gradual distribution as the commits go, with more reason, it won't work either.
Somehow I understood how the short term is not for amateurs, because the entries are much less tolerant of error. Therefore, there is no way to make additions to the positions. It's all or nothing.
Even if you knew that the market is falling, there is not enough time to delay entries. It takes the perfect entry, especially considering that, due to volatility, it is advisable not to leave the stop so short, at least not to fix the last variation in a timeframe of a few minutes.
Sometimes you'll follow a signal, miss it, and go to sleep. Then, the signal will leave the channel and explode. Patience. You cannot watch forever. Maybe you just want to check if the signal output will lead to somewhere interesting, but everything has a limit.
In addition, the market may enter irrational volatility. Patience too. Better to be out as volatility prevents a short stop.